Norwegian Grows September Capacity and Traffic
Norwegian grew September capacity 6% and traffic 7%, lifting load factor to 87.1%, while Widerøe's load factor fell to 71.8% as capacity grew faster.
 Jishan Khan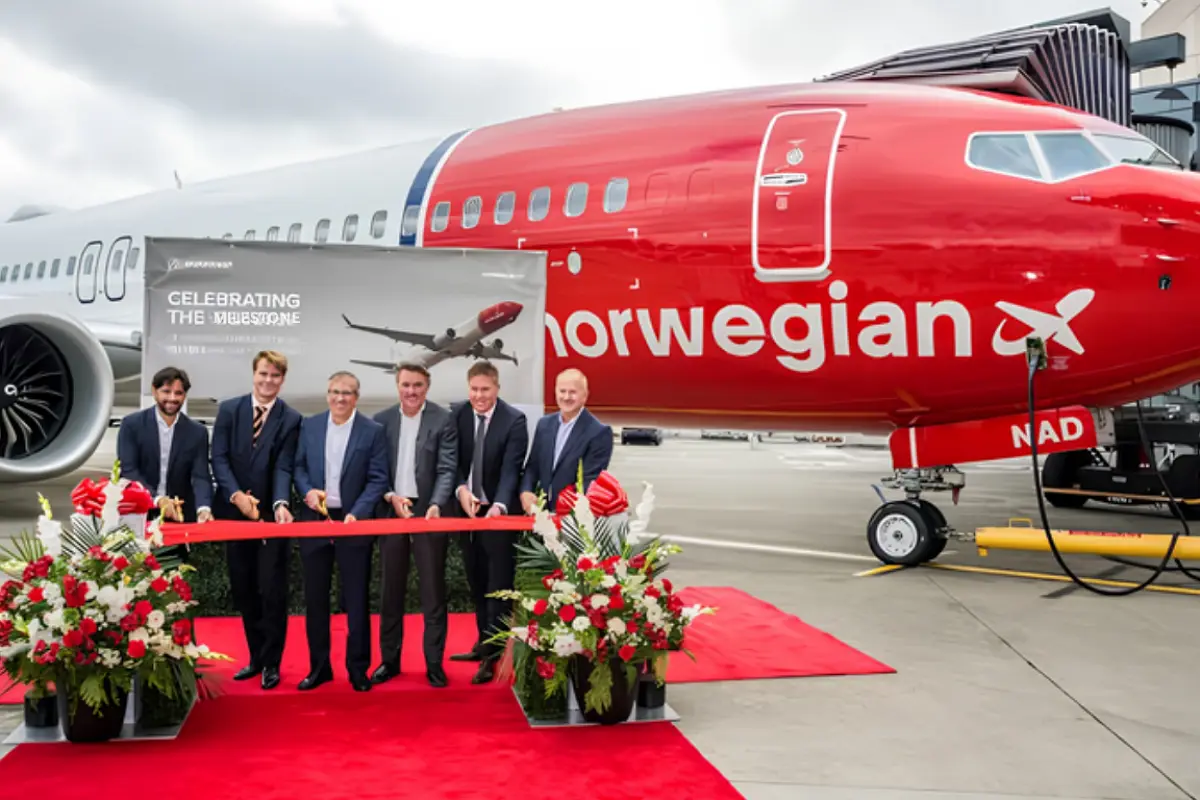
Norwegian Added 6% More Seats and Still Filled a Higher Share of Them, While Its Newest Subsidiary Did the Opposite
Norwegian Group carried 2.8 million passengers in September 2026, with Norwegian itself flying 2.4 million and Widerøe 394,000. The headline number is not what makes the month interesting. Norwegian grew capacity 6% year on year to 3,833 million available seat kilometres, while passenger traffic grew faster, 7% to 3,339 million revenue passenger kilometres. That gap pushed the load factor up 0.6 points to 87.1%. At Widerøe, the same arithmetic ran in reverse: capacity rose 3% but traffic grew only 1%, dragging its load factor down 1.6 points to 71.8%. One group, two airlines, opposite results.
Why Rising Load Factor During Growth Is the Harder Achievement
Adding capacity normally dilutes load factor, because new seats have to be filled before they stop diluting the average. For Norwegian to add 6% more capacity and still lift the share of seats sold means demand outran what the airline put into the market. CEO Geir Karlsen said as much, noting that autumn holidays in all the Nordic countries are showing high demand with many full flights across core markets, and that this is the second consecutive month, after August, in which Norwegian has raised load factor while increasing capacity. August's load factor was 86.3%, so September's 87.1% extends a climb rather than a one-off.
That climb sits on top of an already strong base. Norwegian's first quarter delivered a record first-quarter load factor of 87.6% in what is normally the seasonally weakest quarter of the year, and November 2025 set an all-time monthly record of 85.5%. The airline carried 27.3 million passengers across the group in 2025. An airline that is filling this much of its capacity, this consistently, while still growing, has pricing leverage most carriers do not.
Why the Fleet Detail Matters More Than the Delivery Count
Norwegian took delivery of two new Boeing 737 MAX 8 aircraft on September 30, the 200th and 201st aircraft of its history, and operated an average of 94 aircraft during the month. The delivery milestone is a nice number, but the operational point is more useful: an average of 94 aircraft in service is the base on which the 6% capacity growth was built, and the two new arrivals landed on the last day of the month, so none of their capacity is in the September figures. October is the first month that includes them, which means the capacity added this month will have to be absorbed by the same autumn demand Karlsen is describing as strong, with winter bookings, he says, looking promising.
Regularity of 99.4% and punctuality of 84.3% round out the operational picture. Punctuality of 84.3% is solid rather than exceptional, and it is not directly comparable to the figures this feed covered for SAS, which Cirium measures under its own methodology for a different month. The two Nordic rivals are being scored on different yardsticks here, so the more defensible reading is that Norwegian is running a reliable operation while filling a high share of its seats, rather than that it has overtaken or fallen behind SAS on reliability.
Why Widerøe's Lower Load Factor Is Not the Warning It Looks Like
A 71.8% load factor looks weak next to Norwegian's 87.1%, but the comparison misleads, because the two airlines run structurally different businesses. Widerøe is a regional operator flying short, thin routes, many of them lifeline services to remote Norwegian communities with no practical alternative transport, often on turboprops serving short runways. Those routes have to run on a schedule that makes sense for the communities, not one optimised for maximum seats filled. A regional carrier on routes like these runs a lower load factor by design, which is why the right test for Widerøe is whether the routes keep operating reliably, not whether it matches a leisure carrier's seat-fill rate.
On that test Widerøe scored extremely well: 94.5% punctuality, which the company says ranks among the best globally, with regularity of 98.2%. Widerøe CEO Tore Jenssen framed that reliability as important beyond the airline itself, because for the communities depending on these routes, dependable service is the whole point of the network. The drop in load factor came from capacity growing faster than traffic, which in a regional network can simply reflect new or restored frequencies that have not yet filled. Norwegian bought Widerøe in January 2024 for NOK 1.125 billion, aiming to allow seamless air travel across the two networks, so how well Widerøe's regional feed actually connects into Norwegian's trunk routes matters more to the group over time than Widerøe's standalone load factor in any single month.
What the Winter Booking Picture Says About Where the Group Sees Growth
Karlsen specifically named the destinations driving strong winter bookings: sun destinations such as Egypt and the Canary Islands, city breaks to London and Berlin, and tourist demand into the Nordics themselves, including Rovaniemi and Tromsø. That mix is revealing. Sun and city-break demand out of Scandinavia is the traditional core of Norwegian's short-haul business, while inbound demand to Rovaniemi and Tromsø reflects the winter-experience tourism that this feed has seen several other carriers target this year, such as Discover Airlines adding Finnish Lapland routes and Eurowings expanding its Nordic winter offering. Norwegian is positioned on both sides of that traffic: carrying Scandinavians south for winter sun and bringing foreign visitors north for Arctic experiences.
The Fuel Question the Traffic Release Does Not Answer
Strong load factors do not by themselves guarantee profit, and the fuel cost environment this feed has documented across 2026 remains the obvious pressure on any airline's margin, whatever its seat-fill. Norwegian's traffic release is deliberately a demand and operations document: it reports passengers, capacity, load factor, punctuality and fleet, not yields, costs or hedging. Whether the high load factor is being achieved partly through fare discounting, and how much of the fuel cost increase the airline's pricing and hedging are actually absorbing, will only be visible when Norwegian reports its third-quarter financial results. What the September traffic numbers do establish is that the demand side of the equation is holding up well, with the airline able to grow capacity and fill more of it. For a carrier whose first quarter already showed a significantly lower operating loss and liquidity of NOK 14.2 billion, that is the right foundation for the cost side to be tested against.